I recently completed Concept2’s “Mud Season Madness” challenge which requires participants to row at least 5,000 meters per day for 25 or more days in March. I figured it would be a fun exercise to collect and graph my data to see if I was benefiting from the challenge metrics-wise, or if it would lead to burnout and fatigue.
I rowed a total of 163,322 meters (101.5 miles!) during March on 27 days, for an active day average of 6,049 meters. I originally intended to hit the erg every single day in March, however our son was born early in the month which is as good a reason as any to miss a few days of exercise! My general approach was to alternate days of hard workouts with zone 2/3 steady state rowing to try and manage fatigue.
I was primarily interested in tracking my total meters rowed, pace, and average heart rate. This was easy to collect since I use the Concept2 online logbook and occasionally Peloton rowing classes, and always work out with a fitness band. Since I got the flu in February I didn’t have a ton of data points from the prior month to compare to after filtering out interval work and only considering steady-state workouts, but what I did have was a good representative sample of 5k, 30 minute, and 10k efforts.
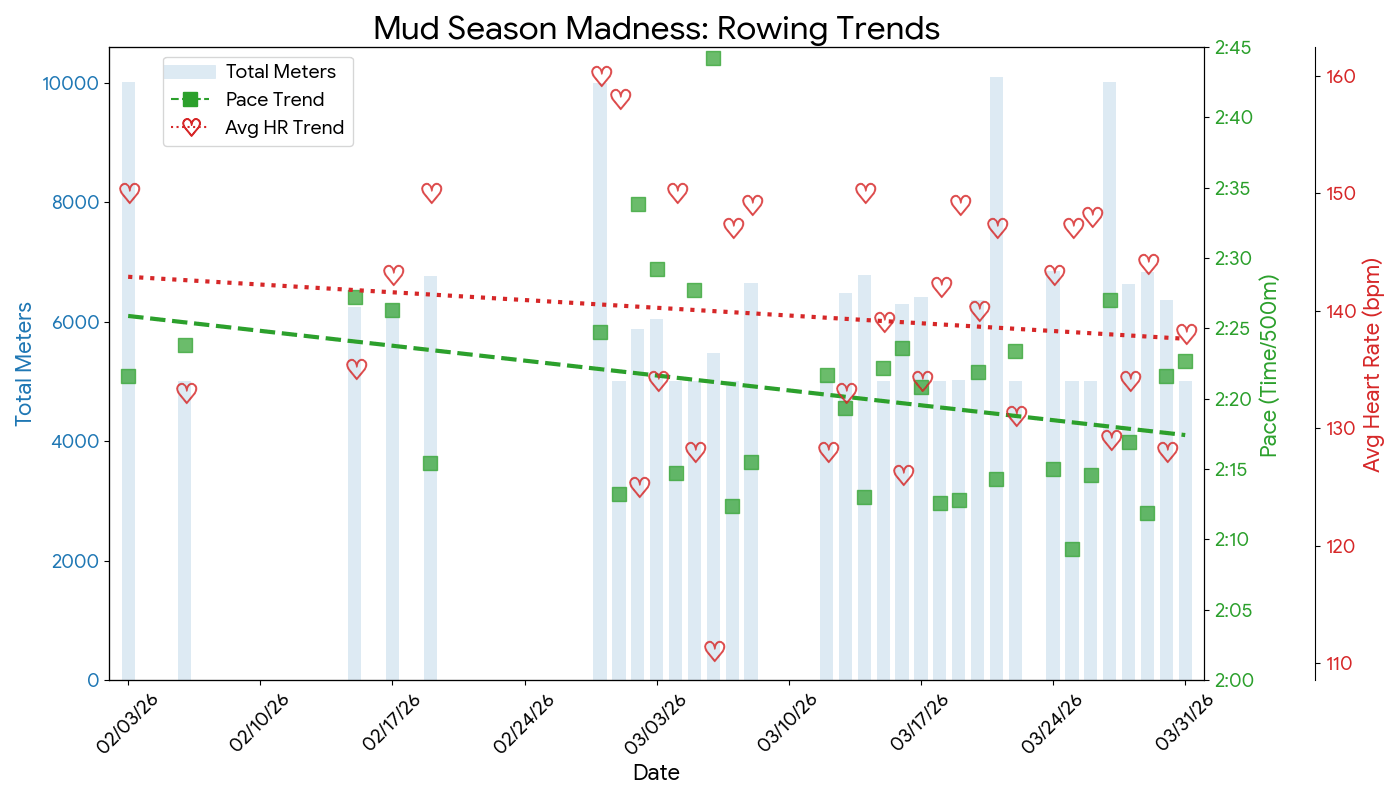
Python made quick work of the data after I organized it into a CSV. Initially I didn’t have a trendline on the graph and wasn’t even sure if I could see a pattern to the data. Once I added a linear regression on both rowing pace and heart rate they show some obvious trends though.
My average heart rate trended from 142.9 BPM to 137.6 BPM, a reduction of 5.3 BPM. Simultaneously my average pace trended from 2:25/500m, to 2:17/500m, shaving 8 seconds off my average split over a variety of distances.
Measuring rowing gains by pace is not very impressive, because pace in rowing is an inverse cubic root function of power. Concept2 uses the following formula which tends to be the gold standard for erg machines:
Consequentially, the faster one rows, exponentially more power is required to reduce one’s split time by the same number of seconds. A 2:25/500m split is equivalent to 114.8 watts, and a 2:17/500m pace is equivalent to 136.1 watts. Therefore I was able to increase the amount of power I was putting into the machine by 18.5% compared to the prior month, all while my average heart rate dropped slightly.
Both those being true simultaneously must mean I got more efficient. Either I got stronger, my VO2max increased, my form improved resulting in less wasted energy, or most likely some combination of all these factors.
I made a table summarizing metrics of interest and how they changed during this challenge:
| Metric | Previous | Current | Delta |
|---|---|---|---|
| Avg Heart Rate | 142.9 BPM | 137.6 BPM | – 5.3 BPM |
| Avg Pace | 2:25/500m | 2:17/500m | – 0:08/500m |
| Avg Stroke Power | 114.8 W | 136.1 W | + 21.3 W |
| 5k Personal Best | 22:16 | 21:37 | – 39 seconds |
| 30 min PB | 6,650 meters | 6,833 m | + 183 meters |
| 10k PB | 47:16 | 45:14 | – 2:02 |
I still have a long way to go to hit my next goal of a sub-20 minute 5k row; I need to cut 9.3 seconds off each split from my personal best time to attain this, or increase my sustained stroke power over 20 minutes from 161.9 watts to 202.5 watts, nearly exactly a 25% increase in sustained output.
I will be curious to continue tracking my stats and see whether I can make comparable progress rowing every other day in April, or if a near-daily frequency is truly beneficial for seeing tangible improvements month-over-month. Given that my current 5k time puts me at just the 35th percentile among male rowers using the Concept2 logbook rankings, it’s likely that I can continue to improve without the crazy dedication of a daily rowing session as long as I train consistently.